
Use ArDB to fulfill your Quality Control requirements
ArDB provides an easy to use mechanism for enabling a full set of Quality Control Statistics calculations.
As well as provide a useful visualization of results and control limits, ArDB can report the calculation breakdown (N, Mean, SD, CV and Z-Score). Simply move the mouse over any result or opt to show the calculation breakdowns in additional columns.
ArDB can straightforwardly run a set of tests ("Shewhart Tests") to detect and highlight potential problems. Simply move the mouse of any highlighted test failures to see exactly which tests have failed.
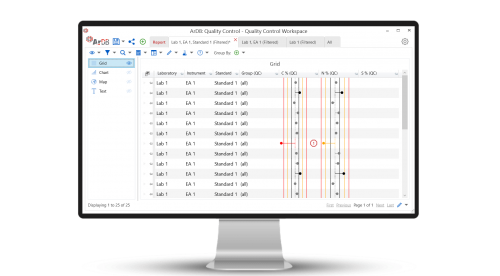
The visualization
The Quality Control visualization can be configured to highlight any multiple of the group standard deviation with different colors.
Long-term monitoring of standards and instrument performance
These Quality Control Statistics coupled with ArDB enable many use cases.
A single ArDB database can be used to record your calibration/monitoring standard results and other performance metrics from one or more instruments across multiple laboratories.
By recording additional meta-data against each record, you can organize your results by sample type, run date, instrument type/identifier, and laboratory name - to name a few.
This extra level of organization allows you to keep all your records in a single database for easy collation and analysis.
Reference database validation checks
When building a reference database of known samples for comparisons with unknown samples, it is important to be confident that the results in your database are consistent.
The Quality Control Statistics calculations and other built-in statistical calculations can be used to verify that new sample submissions are consistent with other results within your database.
Shewhart Tests
ArDB can be configured to run any number of the standard set of "Shewhart Tests" as outlined below.
- 1 point is outside the control limits (3 standard deviations). A large shift.
- 9 points on the same side of the mean. A small sustained shift.
- 6 consecutive points are steadily increasing or decreasing. A trend of drift up or down.
- 14 consecutive points are alternating up and down. Non-random systematic variation.
- 2 consecutive points are more than 2 standard deviations from the mean on the same side of the mean. A medium shift.
- 4 out of 5 consecutive points are more than 1 standard deviation from the center line on the same side of the mean. A small shift.
- 15 consecutive points are within 1 standard deviation of the mean. Stratification.
- 8 consecutive points on either side of the mean, all more than 1 standard deviation away from the mean. A mixture pattern.
Each test can be individually enabled or disabled.
The "Shewhart Tests" internally use the 1, 2 and 3 standard deviation control limits and are not influenced by customizations made to the visualization.
Treating Different Results Differently
It is not always desirable to apply the same control limits and tests to all results.
One or more Quality Control Statistics calculations can be created, each with their own independent settings.
This allows for different control limits and tests to be applied to different results within the same database.
Grouping Records
ArDBs unique Group By setting within the Quality Control Statistics calculation allows for records to be grouped together and Quality Control Statistics to be calculated for each group independently of each other.
This allows for;
- Comparison of results across discrete time periods
- E.g. Group by day, week, month, year, etc.
- Comparison of instrument performance
- E.g. Group by instrument serial numbers, laboratory name, etc.
You can, therefore, utilize a single ArDB database for all of your monitoring needs, which takes the hassle out of designing and maintaining multiple databases.
Ordering Records
For the purpose of performing tests, an Order By option can be applied to ensure that the tests are performed consistently no matter how the data grid is visually ordered.