At a Glance
When working with ArDB there are five main functional areas that you will use;
- Home Screen
- Grid View
- Maps View
- Charts View
- Reports View
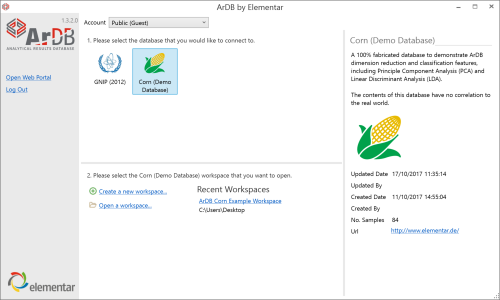
Home Screen
Your work with ArDB will always begin with the Home Screen. From here you can access your various accounts and databases. You can see the status of any particular database and open up a recent workspace.
Workspaces are how you actually work with the data held in the database so when you have selected the database you are wanting to work with you can then create a new workspace or pick up where you left off last time.
You can have several workspaces for any one database allowing you to work in different ways with your data. It is no longer neccesary to copy and share your data with different users, which risks divergence, duplication and loss of control.
Automatic software updates are also made available from this screen keeping your software up-to-date with the latest tools as we devleop them.
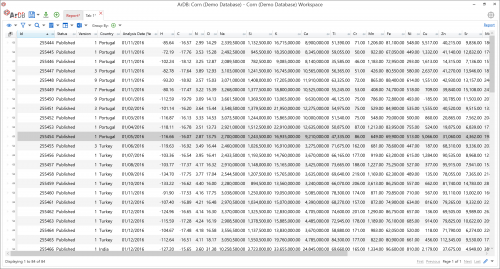
Grid View
When constructing, maintaining or managing your database in ArDB, most of your work is performed in the Grid View.
The Grid View is where every associated result with a particular sample can be seen alongside other "meta data" such as sampling date, GPS coordinates and sample ID for example.
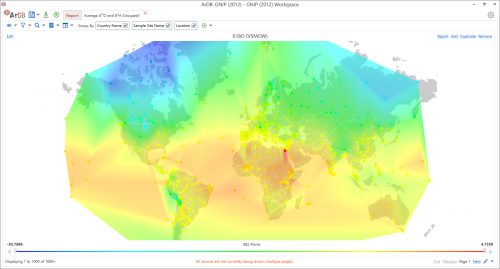
Map View
The geographical origin of a sample can be of crucial importance to your data analysis.
ArDB is a powerful Geographical Information System (GIS) allowing you to plot any number of sample results on a map using the samples GPS coordinates. This lets you interrogate spatial variation in your sample results.
Coupled with the Smart Date stepping functionality it is also possible to determine temporal variations so that daily, monthly, seasonal or yearly fluctuations can easily be visualized.
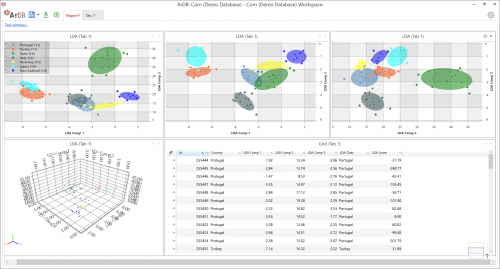
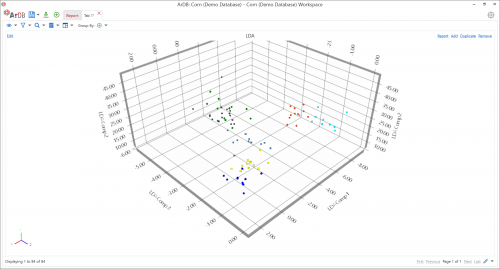
Charts View
ArDB makes it simple to isolate the specific sample analytical results that you need for your analysis.
Large data sets can be reduced using the grouping functionality which aggregates all samples in a particlular group to yield average values.
With your samples of interest filtered from the rest of the database you can begin to uncover the stories hidden in your data using the Charts View.
Reports View
When you have finally got your data organized and you are happy with the visualizations you have created, it it time to think about generating a report for your samples.
The Reports View allows you to bring all of the above elements into a single screen giving you a 360 degree view of your data.
Any visualization can be sent to the Reports View. Each element remains completely interactive and can positioned and resized easily to give you the visibility that you want.
From the Reports View, it is possible to submit "Test Samples" (unknown samples) allowing you to investigate how these samples sit within your known databse.